 Collectible
 Diversification beyond stocks and traditional bonds
One investment, an entire collection: your capital builds a curated portfolio of watches, art, classic cars and more – as a depot-eligible security.
Collectible Invst is a subordinated profit participation bond. A loss up to the total loss of the capital invested is possible; there is no capital protection. The investment is long-term and cannot be sold at any time. Details at www.collectible-invest.com/documents.

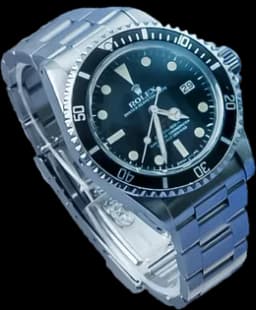


Collectibles, made investable
A single investment
One depot-eligible security (ISIN) that invests in a curated portfolio of real collectibles - diversified across six defined asset classes.
A proven asset class
Over the last two decades, collectibles have shown low correlation to financial markets, resilience when equity markets correct, and an attractive return profile.
Fully managed
Sourcing, authentication, storage, maintenance, insurance and exit - covered end-to-end, giving investors access to an asset class that's otherwise very difficult to navigate.

A proven asset class for modern portfolios
The asset class's performance is tracked by the Knight Frank Luxury Investment Index (KFLII), which spans ten collectible categories, from art and watches to rare wine. What this means for Collectible Invst: The KFLII is the reference for the asset class and the basis of the performance scenarios in the key information document (Basisinformationsblatt). It does not show the performance of this security, which depends on the portfolio actually built. These scenarios range from EUR 9,070 to EUR 18,830 after costs for an investment of EUR 10,000 over the term. No performance can be guaranteed: as a subordinated profit participation bond, a loss up to the total loss of the capital invested is possible; there is no capital protection.
Different value drivers
Collectibles follow different dynamics than traditional markets - scarcity, provenance and collectors' demand.
Sustained long-term growth
Two decades of value appreciation across the collectibles market. Competitive returns at lower volatility - historical five-year annualized returns (2005-2025) ranged from +0.4% to +12.8%, with a mean of about 7% per annum.
Resilient in market downturns
When equities fell hardest (2008, 2020, 2022), collectibles consistently held up far better than the S&P 500 - softening the losses and spreading risk across a portfolio.
What €1 million became over 20 years
Past performance is not an indicator or a guarantee of future returns
Past performance is not an indicator or a guarantee of future returns
S&P 500 vs. KFLII - performance in equity down-quarters
Past performance is not an indicator or a guarantee of future returns
Powered by the Timeless Investments platform
Track record of Timeless Investments:
Collectible Invst is built on the platform of Timeless Investments - operational since 2021, with a proven track record:
- Ecosystem of 50+ specialist partners.
- Proven and robust operational processes.
- Annual external audits of assets and storage conditions by independent experts.
Our investors





**Average annualized gross return (before costs) across all exits on the Timeless platform (avg. +24% per exit over approx. 21 months average holding period; source: timeless.investments/exits, as at September 2026). Past performance is not a reliable indicator of and no guarantee for future results.
FAQ
Everything you need to know about investing in Collectible Invst
Subscribe now.
From EUR 1,000.
Subscribe nowCollectible Invst is a subordinated profit participation bond. A loss up to the total loss of the capital invested is possible; there is no capital protection. The investment is long-term and cannot be sold at any time. Details at www.collectible-invest.com/documents.